

Mathematics
Did you know that 76% of statistics are made up and the other 46% are true?
Hopefully, you have realised, I was 100% making that up! And hopefully, I made you think a little and made you question, for a second, your ability to add (or maybe you questioned my ability to add!). Either way, welcome to the topic of this article: Statistics!!!
Life is full of data and is used constantly all around us even if we don’t know it. Data is used to forecast the weather. Data is used to predict traffic flow on roads. Data is used to decide which TV shows stay on TV and which type of shows to produce. Data is also used to make it more enticing to perhaps flick over to TikTok and watch funny cat videos than continue reading this article.
Data is also used by us purposefully, just like Jerry and Marge, a middle-aged couple from Michigan who used data and the rules of probability to discover a lucrative lottery loophole to win over $27 million dollars (true story, folks, which you can watch on Paramount Plus, but I listened to it first on the ‘Just the Gist’ podcast if that’s more your vibe).
So kids, take note when learning about Statistics and Probability because maybe one day you may also find a lottery loophole (like Jerry and Marge) or just realise that if there is a blue sky in Melbourne this morning then there is likely to be rain, thunderstorms and maybe even snow by the afternoon.
Our Year 7 students have been budding little statisticians recently by looking at their camp data. They then analysed this data which will be presented back to the organiser of the Year 7 Camp- fantastic work Year 7 students. Thank you to Celeste Healy in Year 7 for the following reflection on the Year 7 statistics project.
‘This term in Maths, we have been learning about statistics. We’ve used data from a form we filled out about our camp with questions like “What was your favourite activity?” and “How many times did you fall off the stand-up paddle board?” We have been working on an assignment booklet. We have created graphs, answered questions about types of data and learnt about mean, median, mode and range. Doing this project was a terrific way to learn about statistics. This assignment has been so fun and we have all learnt so much. Such a great project!’
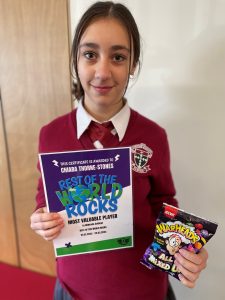
Congratulations also to all students who participated in the TT Rockstars competition back at the end of March. A special congratulations to Chiara Thorne-Stones (Year 8) who came first, followed by Ashleigh Siebel (Year 8) and Sia Seguel (Year 9). Please keep an eye out for our next TT Rockstars competition.
Lastly, in case you wanted more reasons why data is so important, bats eat up to 3000 insects a night so next time those pesky mosquitoes are giving you grief you may want to consider getting a pet bat.
Last lastly, as this fun fact brought up some additional questions that you may like to use data to answer… Did you know cows can walk up stairs but not down them? I would have loved to see the research conducted on that, “C’mon daisy, you can go down. Just take one hoof at a time”. So, my question to you my future statistician/holder of fun facts, ‘Can cows walk backwards downstairs? Or even backwards upstairs?‘
Karen McMullen
Learning Leader: Mathematics